S&P 500 Index Chart Shows Resistance as Stocks Retreat
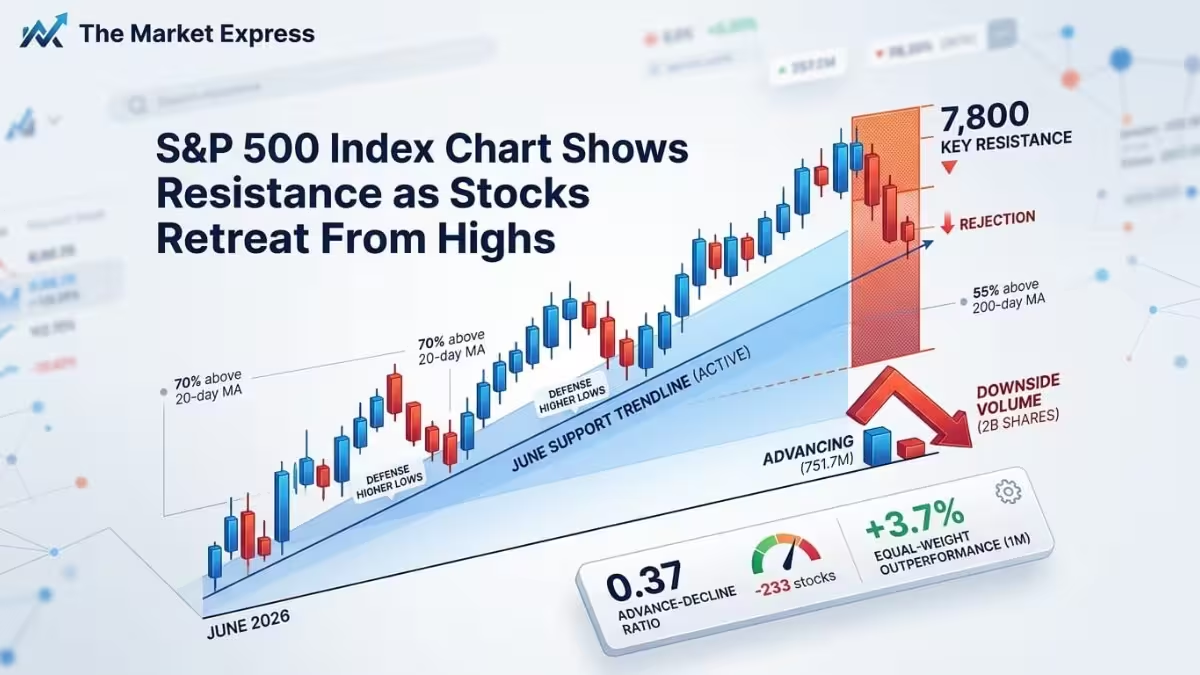
Technical Resistance and Market Breadth Overview The S&P 500 Index chart reflects a broad market retreat as benchmark U.S. equities face mounting technical resistance following an all-time record peak. The benchmark index slipped 0.52% in a single trading session and lost 1.57% over the past five days. Despite short-term softness, the index maintains a robust … Read more