Key Takeaways:
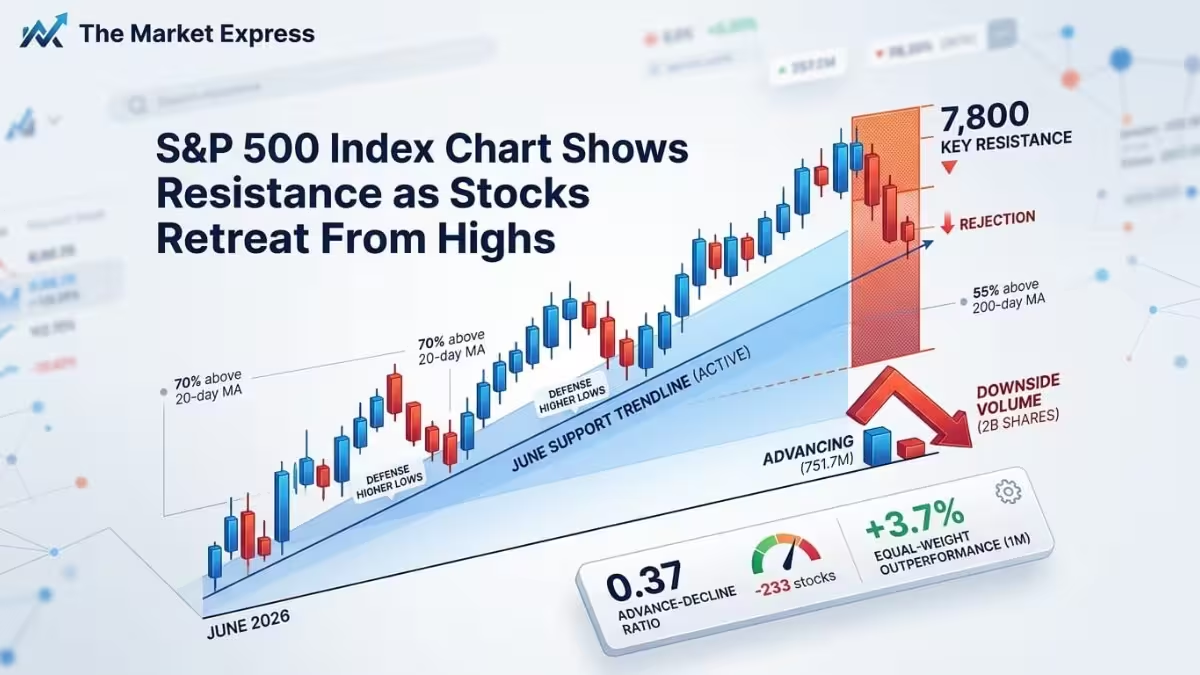
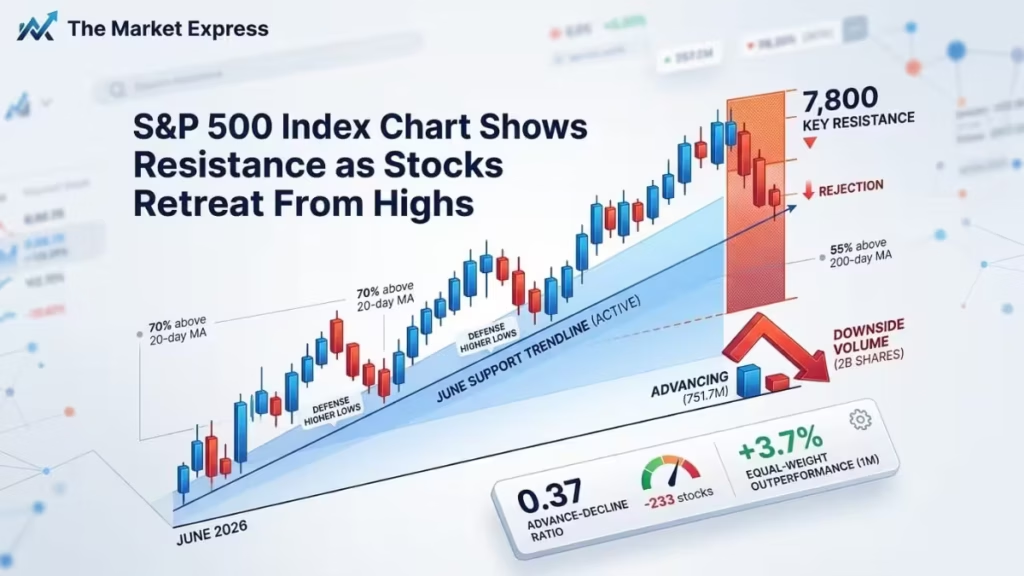
- Single-Session Dip: The benchmark S&P 500 edged down 0.52% after hitting a major chart hurdle around the 7,800 threshold.
- Negative Market Breadth: Internal market metrics showed significant downside imbalance, highlighted by a weak 0.37 advance-decline ratio.
- Structural Support Intact: Key moving average thresholds and an ascending trendline from June continue to offer technical support.
Technical Resistance and Market Breadth Overview
The S&P 500 Index chart reflects a broad market retreat as benchmark U.S. equities face mounting technical resistance following an all-time record peak. The benchmark index slipped 0.52% in a single trading session and lost 1.57% over the past five days.
Despite short-term softness, the index maintains a robust 10.84% gain year-to-date and remains up 13.72% over the trailing 12 months.
A deeper breakdown of internal market breadth highlights widespread liquidation across individual equities:
- Advancing vs. Declining: Only 135 components (27%) recorded gains, while 368 equities (73%) closed lower.
- Volume Distribution: Downside volume reached 2.0 billion shares compared to 751.7 million advancing shares.
- Market Sentiment: “The index is showing signs of bearish pressure after facing rejection from the 7,760–7,800 resistance zone,” noted GOLD_Vision_Analytics, Chief Technical Strategist at TradingView.
Moving Average Support and Price Targets
Solid Moving Average Support: Even with recent market selling, 70% of S&P 500 stocks stay above their 20-day moving average, while 58% and 55% remain above their 50-day and 200-day trendlines, respectively.
According to market analysts, the S&P 500 continues to uphold a broader bullish structure, backed by a rising trendline that has offered steady dynamic support since June. Multiple price reactions along this trendline suggest that buyers continue to defend higher lows,” explained XAUApex, Market Analyst at TradingView.
Key Technical Levels to Watch
- Immediate Resistance Zone: 7,750 – 7,800 points
- Key Bullish Order Block Support: 7,600 – 7,630 points
- Upside Target on Rebound: 7,830 points
Market Rotation & Component Divergence
Equal-weight equity performance has outpaced the cap-weighted index over recent weeks (+3.7% relative gain over a one-month horizon).
- Top Performer: SanDisk (NASDAQ: SNDK) leads trailing 12-month returns (+742.23%).
- Bottom Performer: Fiserv (NASDAQ: FISV) stands as the weakest component (-60.20%).
Mega-cap tech leaders—including NVIDIA (NVDA), Apple (AAPL), Alphabet (GOOG), Microsoft (MSFT), Amazon (AMZN), Meta (META), Broadcom (AVGO), and Tesla (TSLA)—continue to dictate headline index momentum while market breadth broadens into mid-cap components.
Track real-time stock market movements, technical analysis, and benchmark indices at The Market Express Markets Hub.